📊 Financial Indicators Spreadsheet – Take Control of Your Business Finances!
Are you ready to manage your business finances with clarity and confidence? Our Financial Indicators Spreadsheet is the perfect tool for entrepreneurs, small business owners, and freelancers who want to track revenue, costs, expenses, and profitability – all in one place.
✅ What You’ll Learn and Achieve:
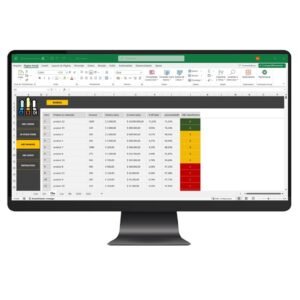
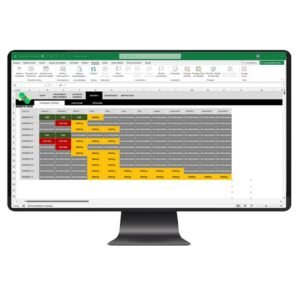
👉 Start by registering your operational revenues – product sales, services, or other income sources. 👉 Easily categorize each entry to keep your cash flow organized. 👉 Record costs, expenses (like salaries, rent, utilities), taxes, and fees quickly and accurately. 👉 Stay on top of your monthly financial control – add revenues, costs, expenses, tax payments, and bank account movements, month by month.
📈 Get Instant Insights With Built-In Reports:
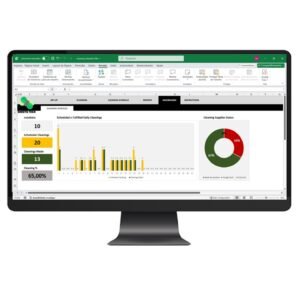
🔹 Financial Indicators Report: Track revenues, costs, contribution margins, gross and net results, and profitability in real time. 🔹 Break-Even Point Analysis: Select a month and discover how many products you need to sell to cover your costs, with key metrics like average ticket, unit cost, and fixed costs.
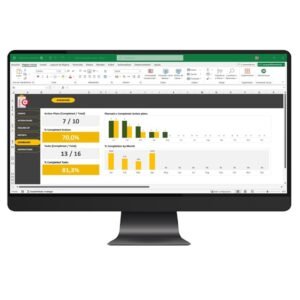
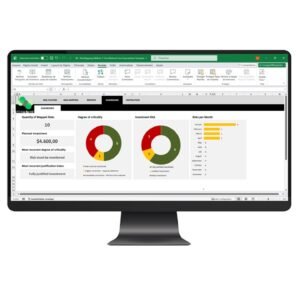
📊 Smart Dashboards for Smarter Decisions:
💡 Visual dashboards give you a clear picture of your financial health:
Compare revenues vs. expenses
Monitor profitability and net income
View break-even insights and product sales per month
🎯 Simple to use, powerful in results – this spreadsheet was designed to help you make informed decisions and boost your business growth.
Watch the video about the Financial Indicators Excel Spreadsheet Template
Reviews
There are no reviews yet.
Only logged in customers who have purchased this product may leave a review.


Reviews
There are no reviews yet.